
Quant Mode
Institutional analytics, explained in plain English.
Risk, CAPM, optimisation, Monte Carlo and backtests — the tools usually kept for professional desks, run on your real PSX portfolio, with a note on what every number means.
Analytics desk
Your portfolio, measured.
Quant Desk
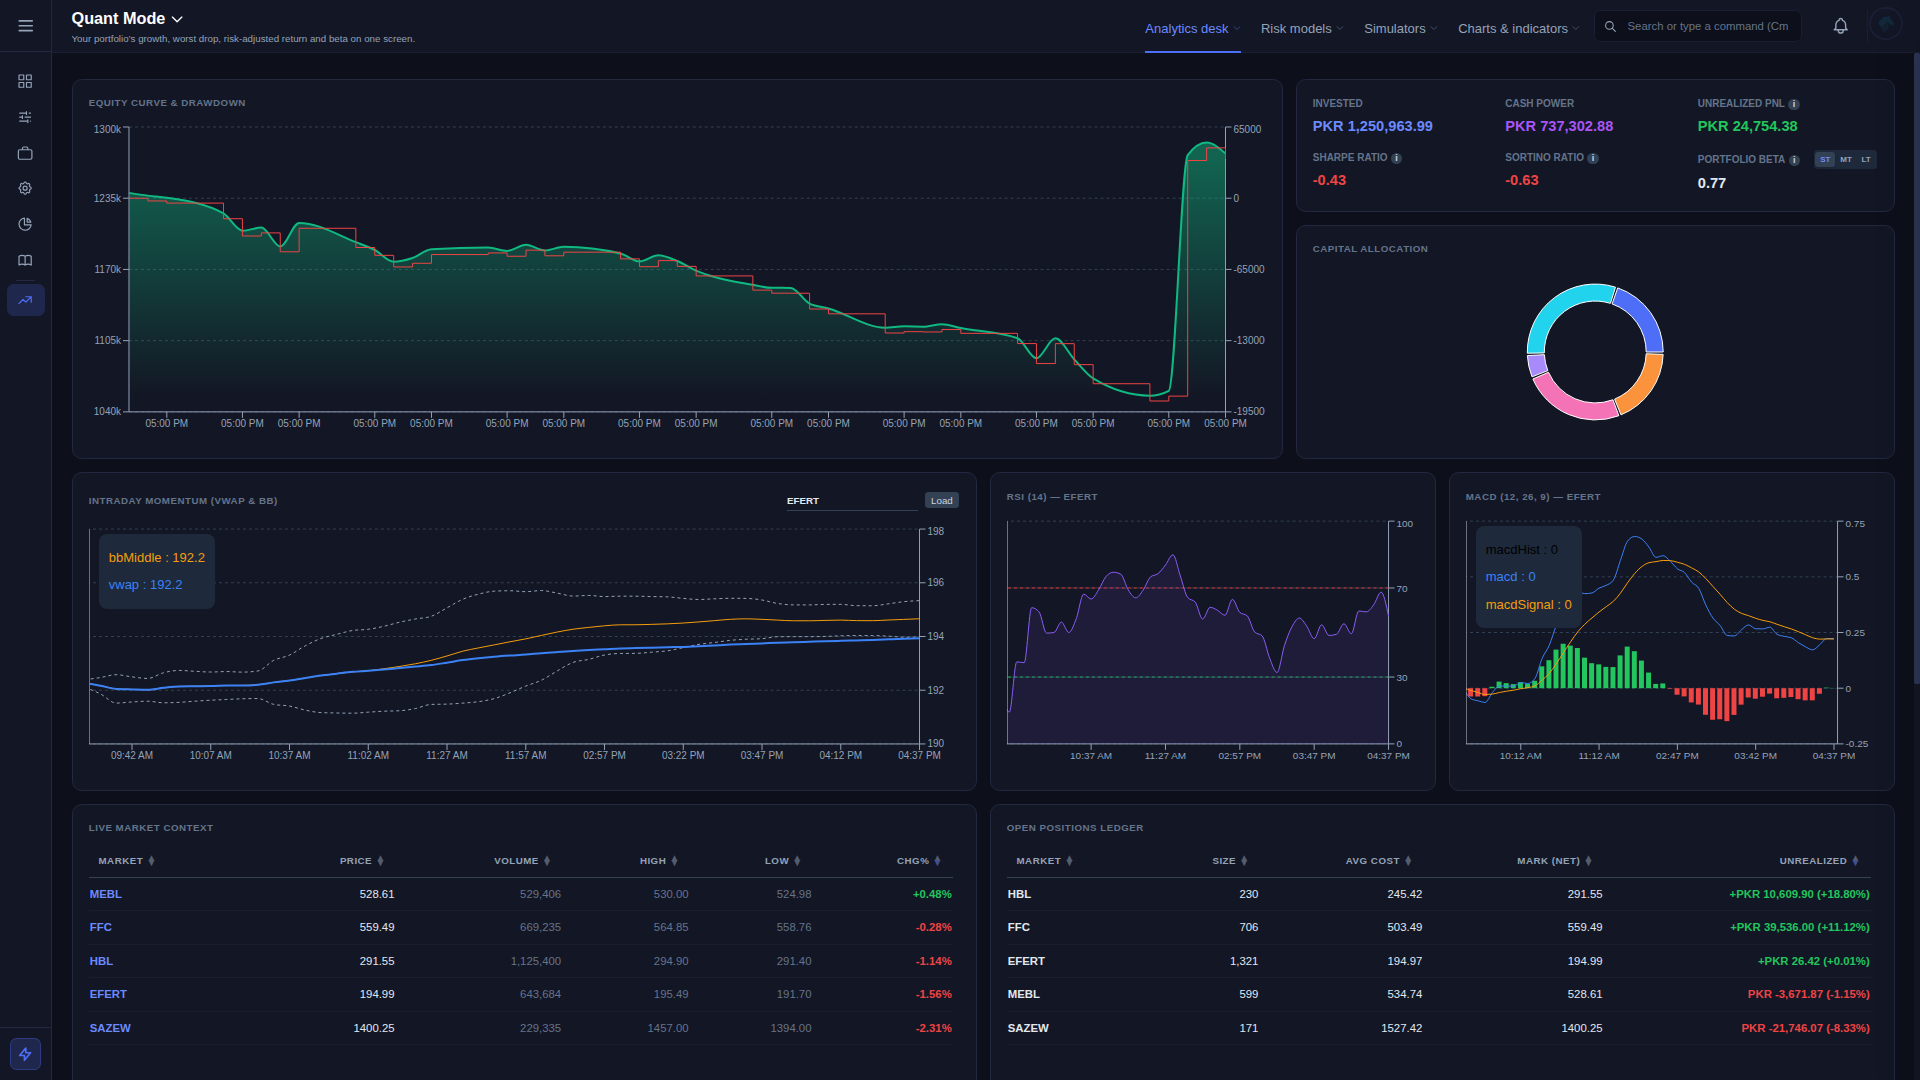
Your portfolio’s growth, worst drop, risk-adjusted return and beta on one screen.
Intraday technicals
Five-minute VWAP, RSI, MACD and Bollinger Bands for a stock during the trading day.
Risk models
How much risk, and whether it pays.
Risk & correlation
How much your portfolio could swing, and which of your stocks tend to move together.
CAPM
Whether each stock pays you enough for the market risk it carries, plotted on the security market line.
Sharpe & Sortino
How much return you earn for each unit of risk, compared with a risk-free T-bill.
Portfolio optimizer
Suggests how much of each stock to hold for the best return at your chosen level of risk — and the buys and sells to get there, with fees.
Simulators
Test ideas before you trade them.
Monte Carlo
Simulates thousands of intraday price paths for a stock to estimate the chance of profit and of reaching your take-profit or stop-loss.
Backtest
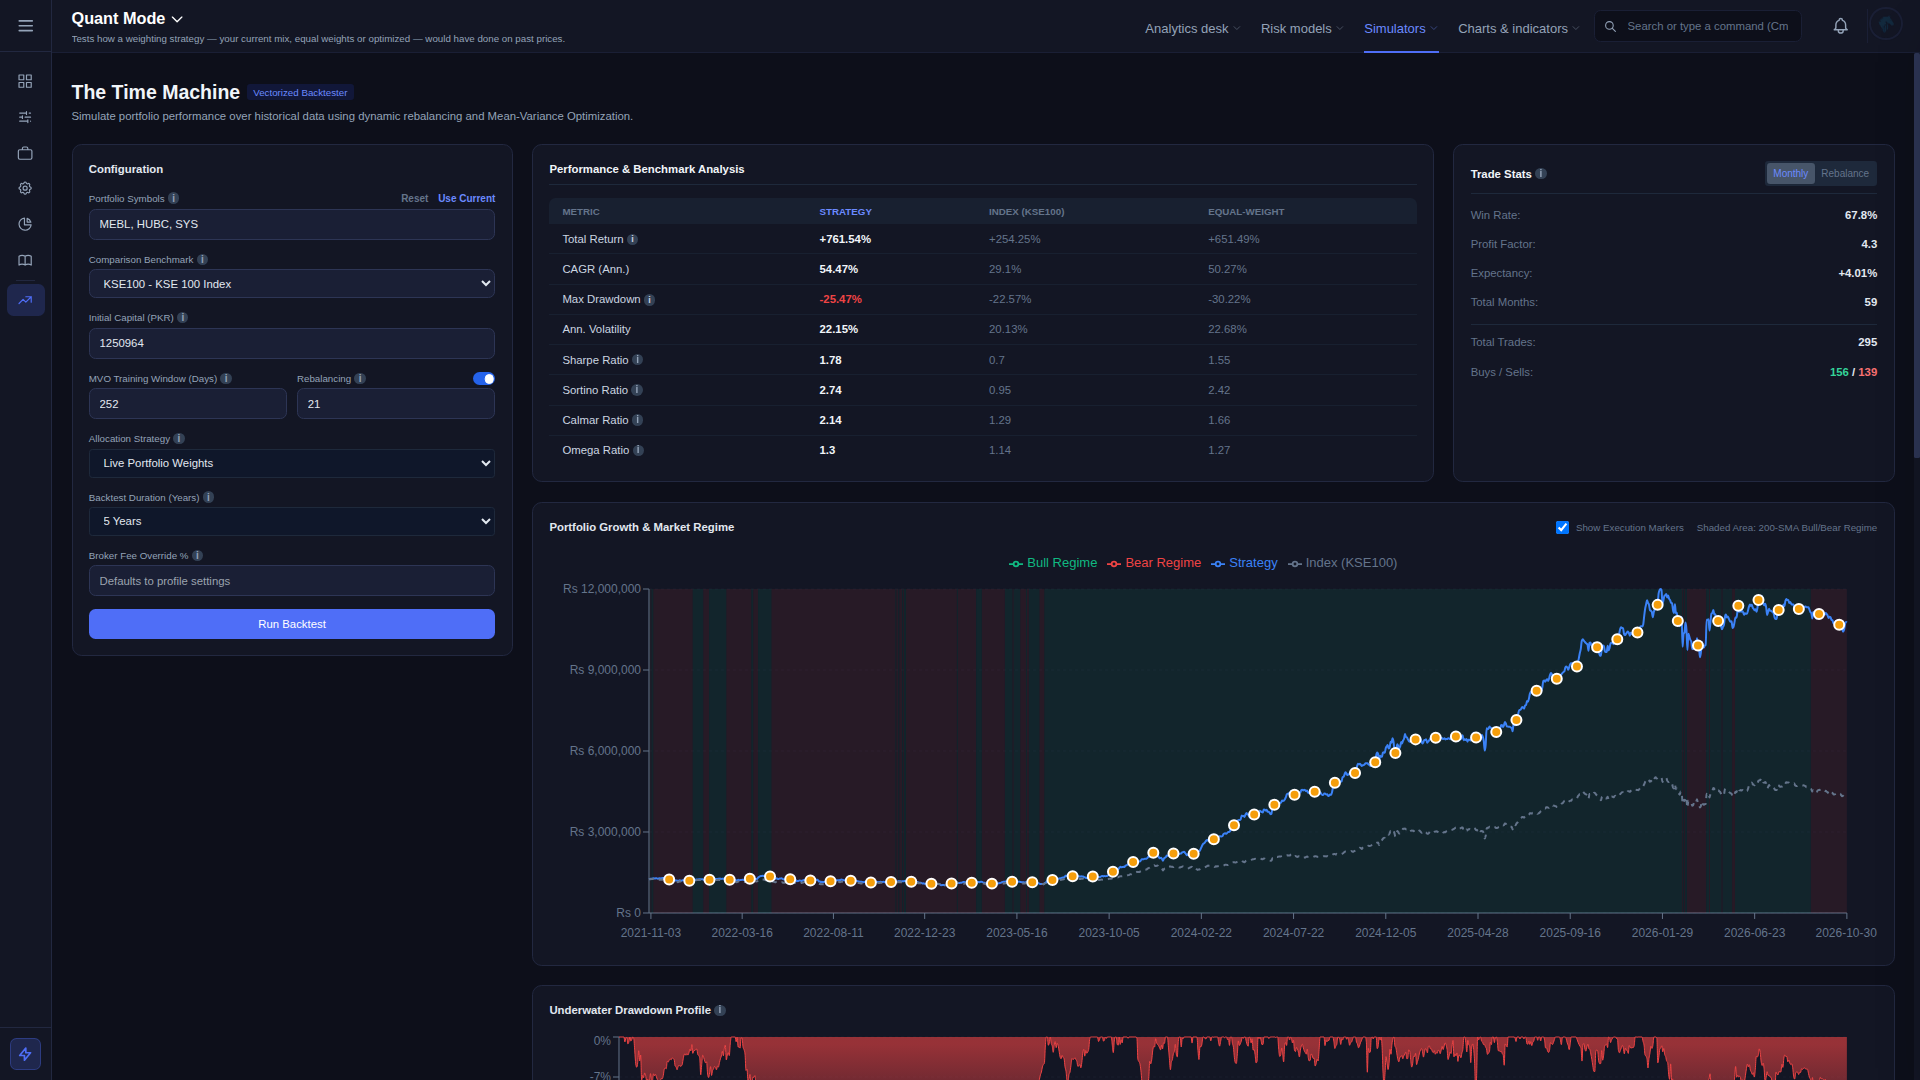
Tests how a weighting strategy — your current mix, equal weights or optimized — would have done on past prices, against the KSE-100.
Charts & indicators
For the chart readers.
Alpha & beta oscillators
Shows whether your stocks beat the KSE-100 (alpha) and how closely they follow it (beta).
Advanced charting
Full candlestick charts with indicators and drawing tools for any stock.
Clean data
Models are only as good as their prices.
Quant results go wrong quietly when the price history is wrong. LAZAZ fixes the usual PSX problems before any model sees the data.
Splits and dividends adjusted
Stock splits and cash dividends leave artificial gaps in past prices. They are adjusted out before risk and optimisation run.
Post-close flat periods trimmed
PSX prices stop moving after the session settles. Those flat minutes are cut, so intraday beta reflects real trading.
Benchmarks lined up
Your portfolio and the KSE-100 are compared over exactly the same dates.
Plain-English help
Every tool has a one-line description and “What does this mean?” notes on the key numbers — beta, Sharpe, drawdown and more.
Put your portfolio through the models.
Quant Mode works on the stocks you hold — add them and every tool is ready.